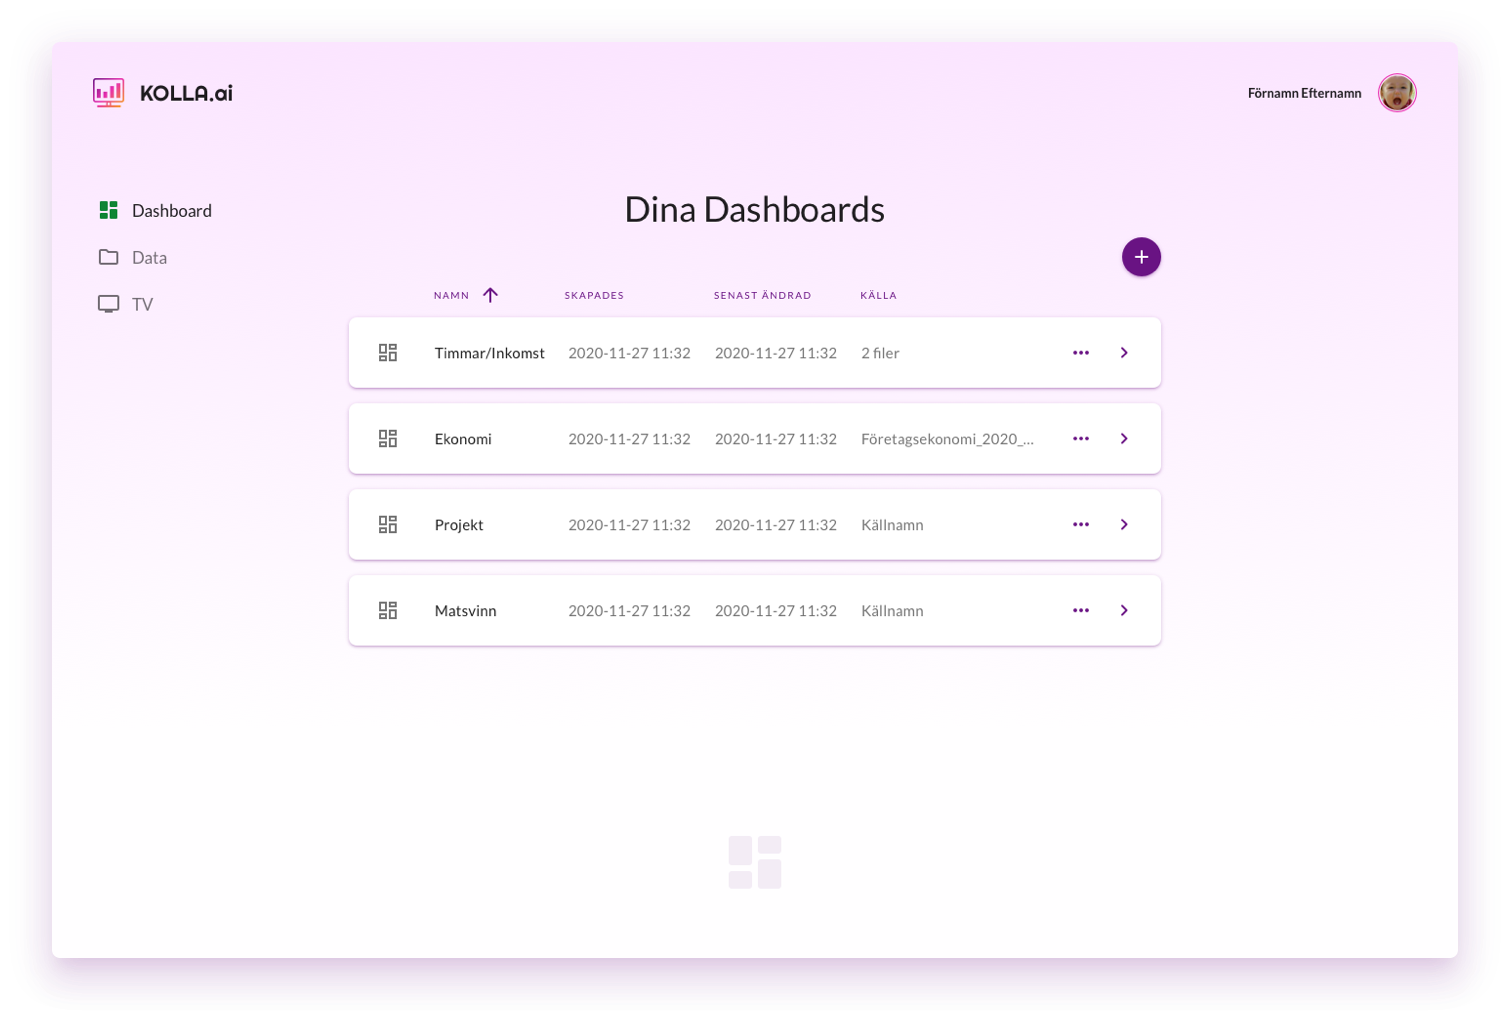
Visualizing data should be easy
We want to make visualizing data from different sources easy. Kolla has a long list of integrations that makes adding data to your dashboard dead simple and the list is always growing. Want to create a graph where you compare Google Analytics data with data stored in a spreadsheet on Google Drive or Microsoft OneDrive? Kolla is the tool for you.
Templates tailor made for your business
Different businesses have different needs. Kolla will soon provide templates for several kinds of businesses. Whether you are running an E-commerce site, a brick-and-mortar store or a consultancy business, with Kolla's templates you can easily create a dashboard that displays the data you need to see.
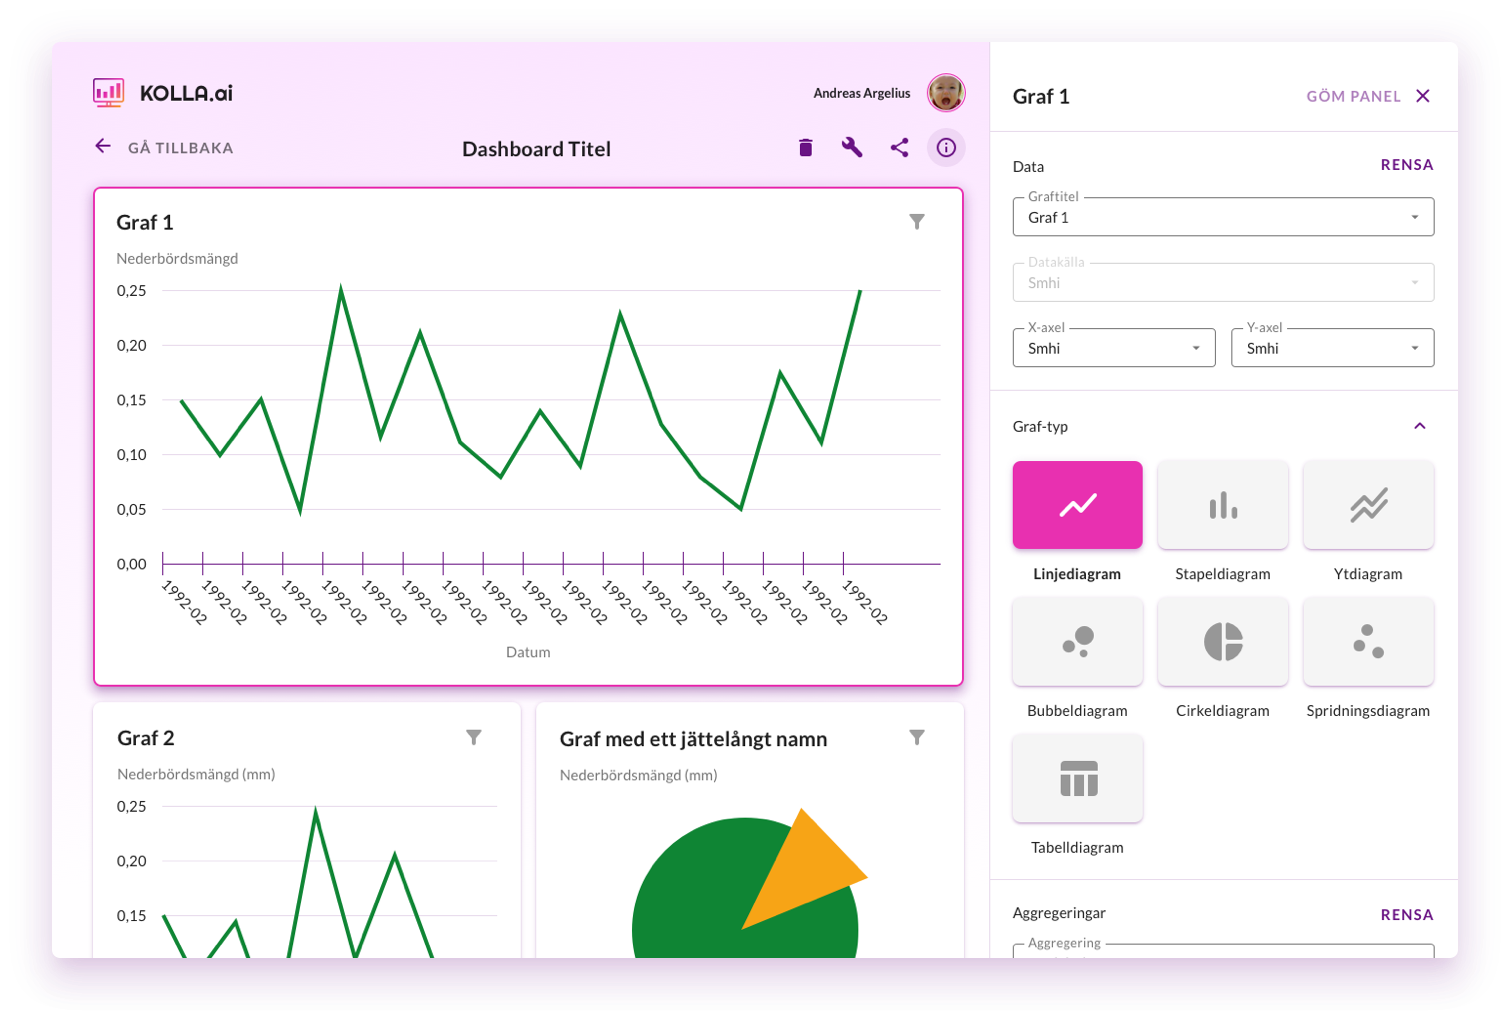
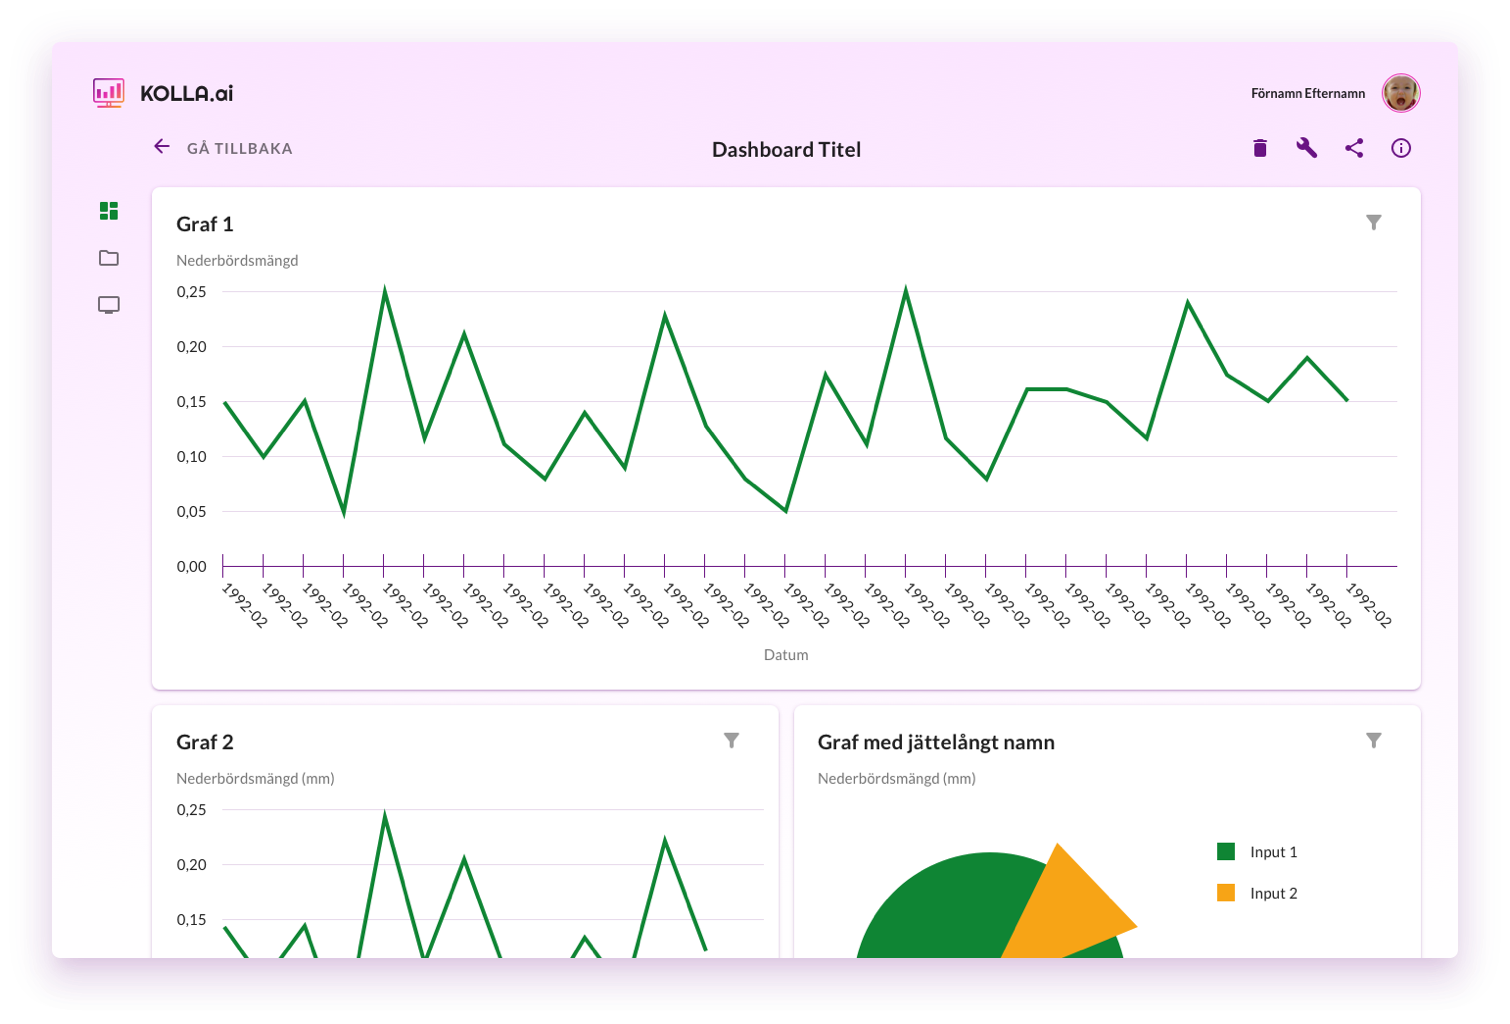
Fully customizable
Dashboards in Kolla have a lot of different customization options so you can present your data in the way you want it to look. Several different types of graphs are supported such as bar charts, pie charts and many more. With our KPI feature you can add KPI values to your dashboard that will dynamically update based on your data.